Fun With Charts!
I used to teach Economics to evening students. They were mainly adults working full-time jobs and attending college at night. To many of them, the idea of understanding a supply and demand curve, or even a chart of any kind, was terrifying. I always started with the basics, and as we added pieces, I could (almost) literally watch the light bulbs go on. They got it!
We suspect some of our readers may have a similar fear about reading the charts we include with our newsletters and memos. Fears aside, we include them because we believe the information they provide will help us better understand the issues that shape how the markets move. (Have no fears: there are no quizzes.)
Admittedly, some charts are more interesting than others. Take a peek, and don’t forget to send us any questions you may have.
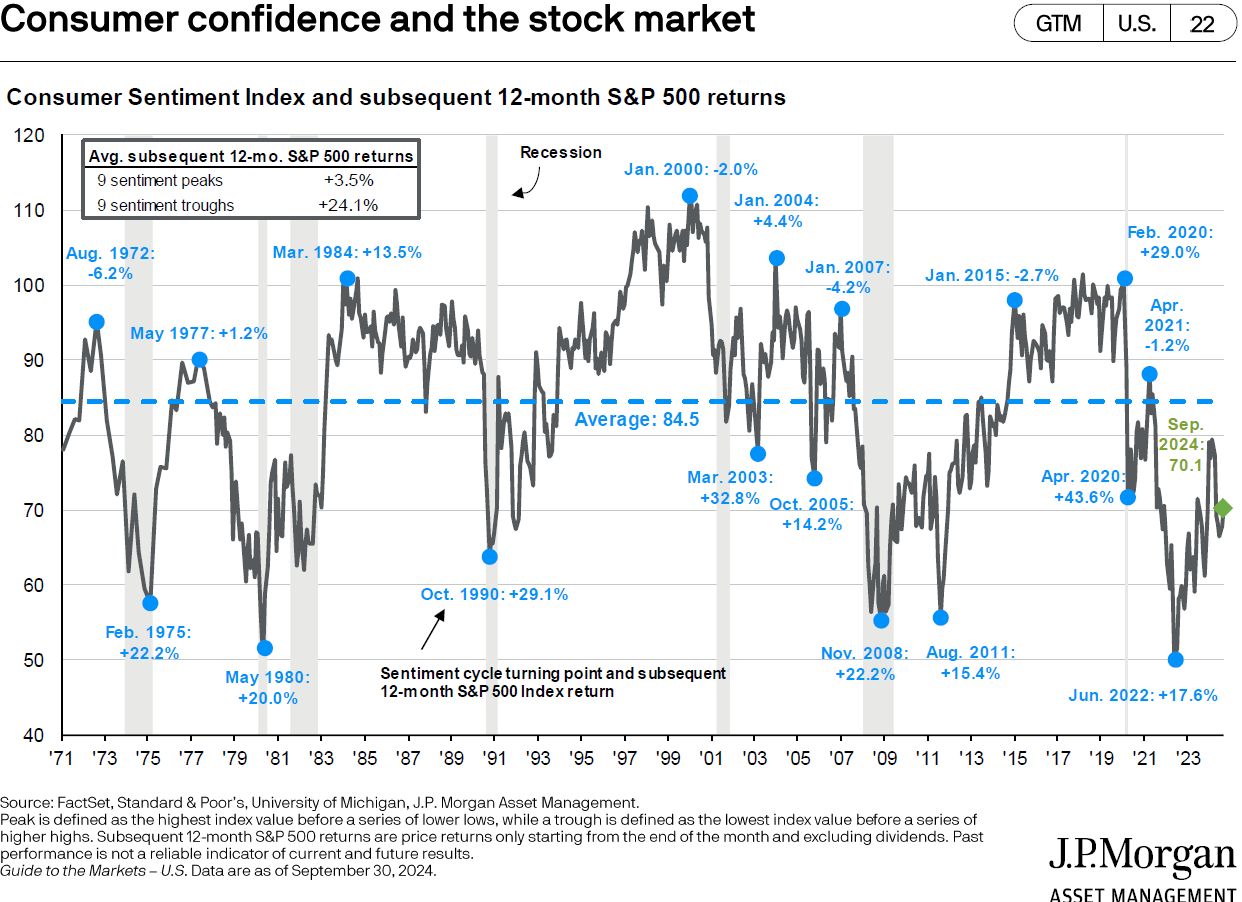
Consumer Confidence: When consumers feel confident, they spend money. And when we spend money, retail sales - and often profits - go up. Along those same lines, if we believe good times are ahead, investors will buy equities, assuming those investments will grow over time. Thus, it’s interesting to see how markets react when consumer sentiment is either high or low.
The chart below1 demonstrates that when consumer confidence is low but begins to turn, the stock market's performance is positive over the ensuing period. (The blue dots on the lower half of the chart represent low points for consumer confidence.) Notice, however, how market performance moves higher as consumer confidence recovers. The reverse occurs when consumer confidence peaks, periods which are shown by the blue dots on the upper half of the graph, followed by falling markets.
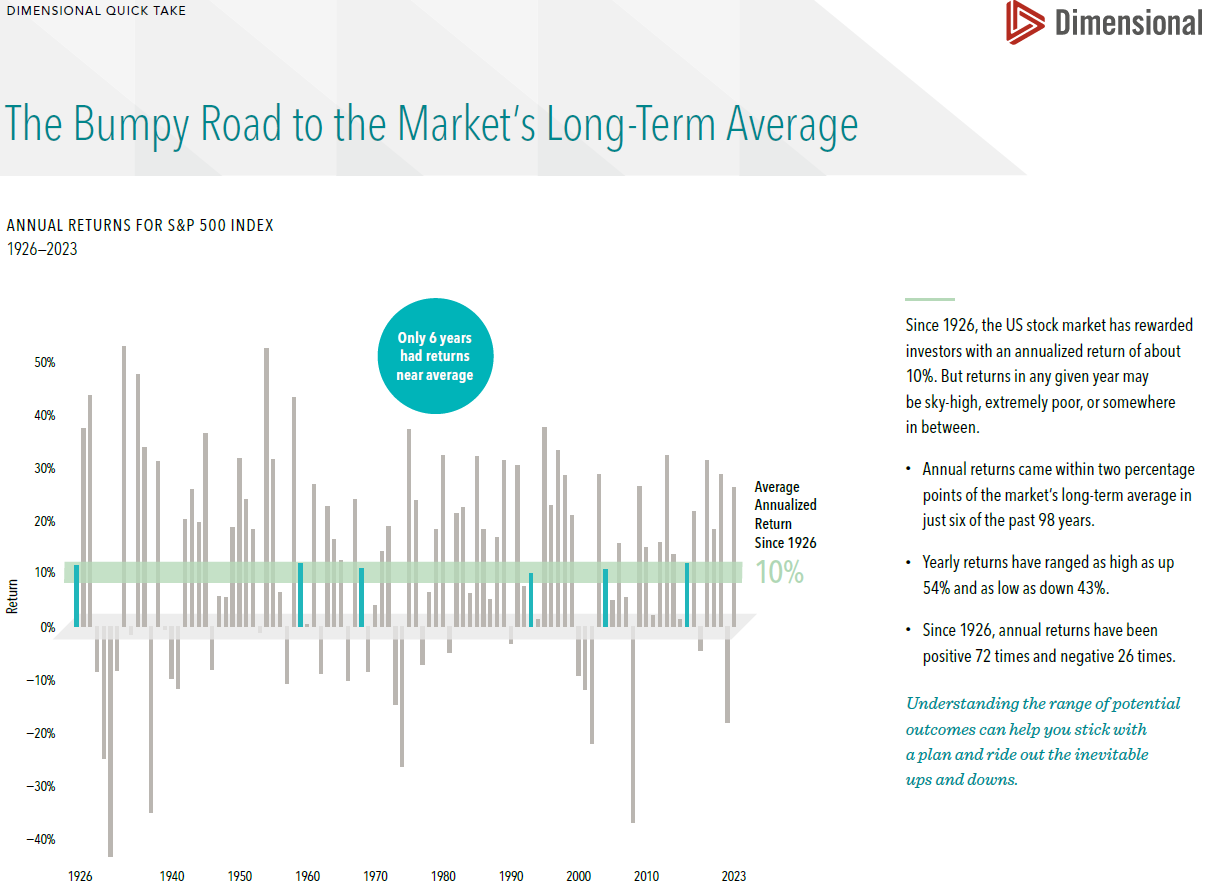
It's not 10% every year! It’s true that the S&P 500 has average gains of approximately 10% per year over the past 100 years. But it’s also true that a person can drown in a lake that averages a depth of 4 feet if he/she dives into the end that is 10 feet deep. In other words, double-digit average returns are nice, but markets rarely achieve that exact return in any given year.2
1 “Consumer confidence and the stock market,” Slide 22, Guide to the Markets, J.P. Morgan. September 30, 2024.
2 “The Bumpy Road to the Market’s Long-Term Average,” Dimensional. January 2024.


