Fun With Charts!
Rebalancing—A Visual Representation
Part of our role in managing your money is to do so in a tax-efficient way. Excessive trading, for example, doesn’t necessarily translate into better returns. In fact, it can often lead to unnecessary taxes and excessive costs.
Equally important is measuring risk. If investors invest too much in equities, for example, they may not be able to tolerate substantial losses in the stock market. Thus, rebalancing portfolios over time can potentially address these types of issues.
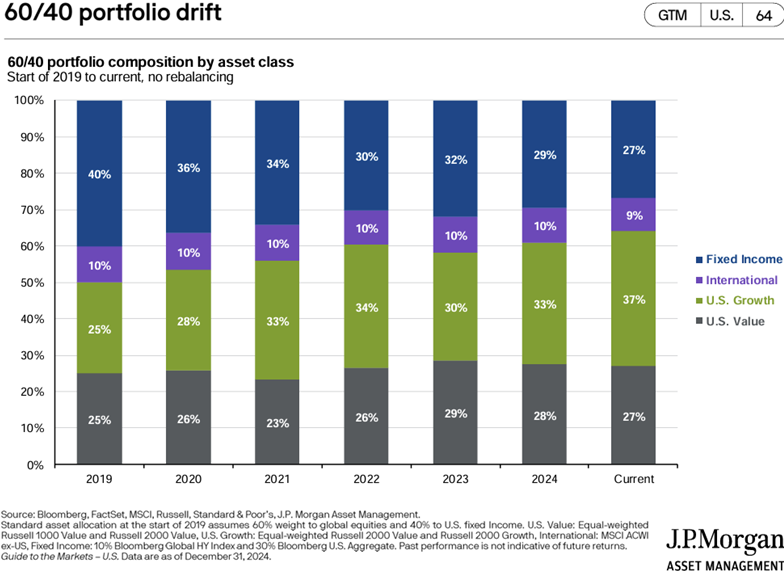
The chart below1 depicts what happened to a 60/40 portfolio from 2019 that was initially invested in 40% fixed income, 25% US growth stocks, 25% US value stocks, and 10% international stocks.
If left unmanaged, the current portfolio would be too risky for many investors, potentially putting them at serious risk if the market was to drop significantly.

Can you get to $2 trillion?
With a new administration taking office in January, there has been substantial discussion in recent months about cutting the federal budget by up to $2 trillion. While the number is imposing, let’s consider where our tax dollars are spent.
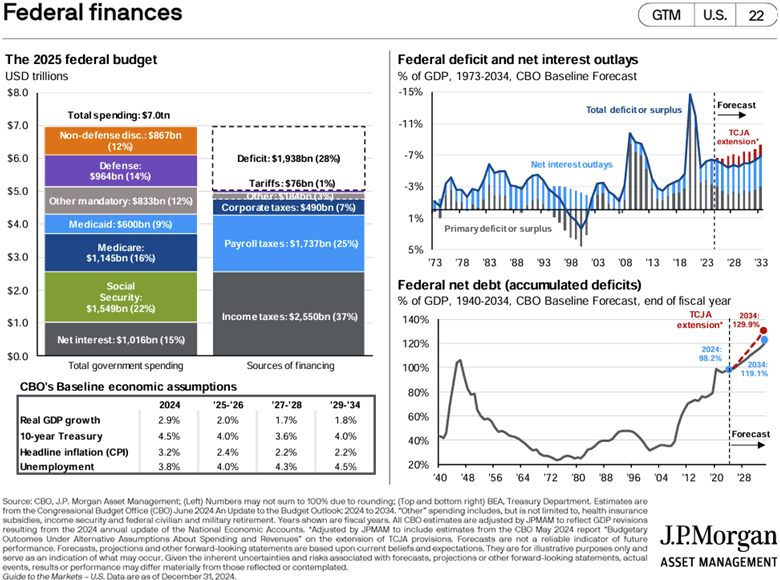
Reviewing the chart below2, total spending is approximately $7 trillion, which includes:
Defense spending: 14%
Net interest on US debt: 15%
Social Security: 22%
Medicare: 16%
Medicaid: 9%
Other mandatory spending: 12%
Non-defense discretionary spending: 12%
Large cuts could prove difficult, considering that Medicare, Social Security, Medicaid, defense, and net interest total more than $6 trillion.
Consumer finances: early signs of worry?
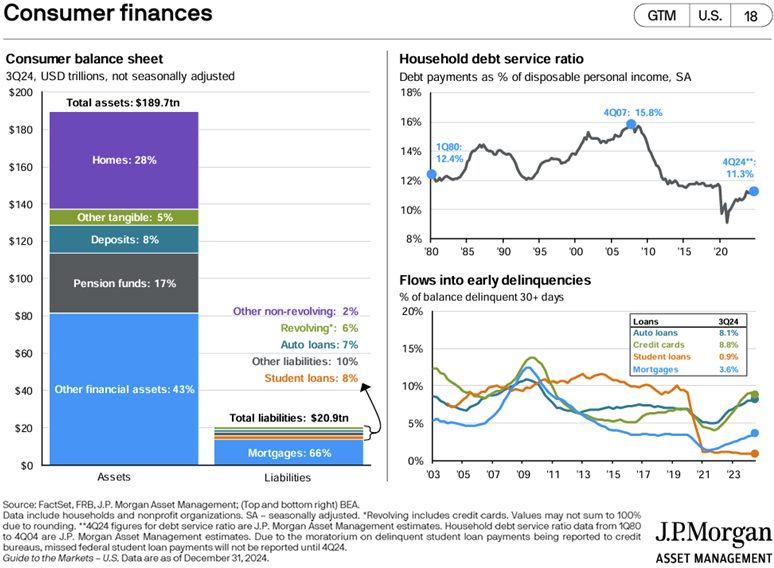
While the consumer balance sheet may look strong (see the chart below), looks can be deceiving. Two charts3 in particular point to some concerns ahead.
The first, household debt service ratio (top right, below), shows debt payments as a percentage of disposable personal income increasing to 11.3%. While some increase from the COVID lockdown was expected, the increase is still worth noting. The reason: the more consumers spend on debt, the less they can spend on other purchases that help keep the economy humming.
The chart in the bottom right corner (below) shows debt delinquencies, which are also rising. When consumers get overburdened with debt, they must prioritize which debts they can afford each month. As the chart shows, delinquencies for mortgages (3.6%), credit cards (8.8%), and auto loans (8.1%) are all on the increase. Those are numbers to watch because when consumers can’t satisfy their debt, there may be potential consequences for the economy.
1 “60/40 Portfolio Drift,” Slide 64, Guide to the Markets, J.P. Morgan. December 31, 2024.
2 “Federal Finances,” Slide 22, Guide to the Markets, J.P. Morgan. December 31, 2024.
3 “Consumer Finances,” Slide 18, Guide to the Markets, J.P. Morgan. December 31, 2024.
Please remember that past performance may not be indicative of future results. Different types of investments involve varying degrees of risk, and there can be no assurance that the future performance of any specific investment, investment strategy, or product (including the investments and/or investment strategies recommended or undertaken by S.F. Ehrlich Associates, Inc. (“SFEA”), or any non-investment related content, made reference to directly or indirectly in this newsletter will be profitable, equal any corresponding indicated historical performance level(s), be suitable for your portfolio or individual situation, or prove successful. Due to various factors, including changing market conditions and/or applicable laws, the content may no longer be reflective of current opinions or positions. Moreover, you should not assume that any discussion or information contained in this newsletter serves as the receipt of, or as a substitute for, personalized investment advice from SFEA. To the extent that a reader has any questions regarding the applicability of any specific issue discussed above to his/her individual situation, he/she is encouraged to consult with the professional advisor of his/her choosing. SFEA is neither a law firm nor a certified public accounting firm and no portion of the newsletter content should be construed as legal or accounting advice. A copy of SFEA’s current written disclosure Brochure discussing our advisory services and fees is available upon request. If you are a SFEA client, please remember to contact SFEA, in writing, if there are any changes in your personal/financial situation or investment objectives for the purpose of reviewing, evaluating, or revising our previous recommendations and/or services.


